
“The greatest wealth is health” (Virgil, Ancient Roman poet). There is nothing more important than taking care of ourselves and each other. However, focusing a health system on the appropriate goals in a complex political and social environment requires investment in the right combination of time, money, intellect, and creativity.
Government agencies are bringing pressure on healthcare providers, vendors, and insurance companies. For decades, our health system has been revenue driven, often with somewhat irrational pricing. Healthcare leaders must now pay closer attention to the middle line – costs – not just the top line (revenues) when working to improve the bottom line (profits).
The only financial value a healthcare facility will ever create for its stakeholders is the value it derives from its patients — its current patients and new ones to be served in the future. Healthcare organizations should view patients similarly to how commercial companies view existing and prospective customers. To remain competitive, healthcare facilities must determine how to keep patients and their families coming back to satisfy medical needs throughout their lifespan and to serve them more efficiently. To do this, they must maintain a high level of quality and patient satisfaction, while growing revenue and controlling costs.
Healthcare organizations today still have a gap between the financial and clinical staff’s agenda. That gap can be closed by building a bridge between patient outcomes, pricing, costs, and profits. Profits (For-profit systems) and sustainability/growth (For-profit and Nonprofit systems) are what the healthcare owners are seeking. In marketing terms this is referred to as value.
Value = Quality / Price
Everybody wants value in return for whatever they exchange. Customers and patients conclude they receive value if the benefits received from a product or service meets or exceeds what they paid for it (including time, investment, quality, and cost). But shareholders and stakeholders believe if their investment return is less than the economic return they could have received from equally or less risky investments (e.g., a U.S. Treasury bill), then they are disappointed. Value to employees is another issue altogether, usually tied to compensation, stability, and job satisfaction.
What are the tradeoffs in providing value to these three groups? Is there an invisible hand controlling checks and balances to maintain an economic equilibrium so that each group receives its fair share? Adding to the conflict, “fair share” is a subjective concept (ask any politician). Are some groups more entitled to receiving value than others?
As the model of healthcare shifts focus from fee-for-service-centric to a fee-for-performance-centric, some insensitive truths about high-volume unprofitable patient services must be analyzed. That doesn’t necessarily mean those services should (or can) be discontinued. Are these services a “necessary evil” for the entire healthcare system or do they satisfy a basic need for the community? The labor and delivery of some services can lose money. However, the widely held belief is that mothers will come back for additional services in the future, and perhaps even the whole family will stay in the system for years to come. This may be nice in theory, however can it be proven with information generated from the healthcare facility’s management accounting system?
Unfortunately, many hospital management accounting systems aren’t able to report services, treatments, procedures, and patient profitability information. Without reliable and accurate accounting information they are limited to support analysis for how to rationalize which types of patients to retain, grow, or win back and which types of new patients to attract that will be in harmony with the hospital’s specialties, competencies, and expense structure. Commercial companies refer to this as “customer rationalization”. Hospitals need similar thinking – “patient rationalization”.
Social media messaging about a health system and its competitors on websites like Facebook, yelp and Glassdoor are becoming part of the decision process when a patient is “shopping” for medical care. Patients are increasingly becoming price-sensitive savvy buyers for their own healthcare needs. The general public may not know what HCAPP stands for or the technical definition of Readmission Rate, but they absolutely know about it when grandma gets an infection during her stay at a hospital, or if a friend was readmitted twice back into the ER after being discharged from an inpatient stay.
Perception is Reality. Reality is Reality. Healthcare facilities must strategically shift their actions toward differentiating their services, patient cost containment, revenue cycle management, while also improving patient outcomes. With traditional accounting’s emphasis on only the costs of treatments managers can’t see the total income statement picture. Managers deserve to view all of the profit margin layers that exist. They should view reporting information from all patient-related expenses including non-standard patient services and payment behavior. Ultimately a profit and loss statement should be measured and reported for each patient stay and better yet across a patient’s history within the health system.
Positive versus Negative Margin Patients
So, what are the troublesome patient services, treatments, and procedures, and how much do they drag down the whole system’s profit margins? What are the high-profit patient treatments and services, and are they enough to offset the low-or-no profit margin yet necessary patient services? What’s the difference between these? More importantly, once these questions are answered, what corrective actions should healthcare leaders and employees take to increase the overall profit of their health system and to get those action items prioritized? It is expected that expenses for certain types of patients will exceed their revenues. That is a policy and community issue. But at least the hospital should know the magnitude of this deficit spending and for which types of patients.
Clinical staffs already intuitively suspect that there are highly profitable and highly unprofitable patients. After all, they are living the day-to-day and know which type of patients tend to take more of their time, and even why. Patient types can be categorized in several ways including: treatment, service, financial class, age group, gender, Primary Service Area (PSA), US Postal zip codes, comorbidity, diagnosis, procedure, and even socio-economic factors. In today’s highly-rich healthcare data environment the list of patient categories is immense. Therefore, there are many ways to consider, understand, and ultimately manage patient profitability. Health systems need to not only increase market share and grow volumes but to understand what’s profitable and what’s not profitable to identify the right mix of patient types and service volumes. What is needed is a mind shift to grow profitable volume.
In commercial companies, some types of customers purchase only a mix of mainly low-profit margin products. The same goes with treatments needed by patients. In addition some extra services may be medically necessary. For example, a diabetic patient is going to require a higher level of care than a non-diabetic patient (all else being equal) due to dietary requirements and other medical considerations. In commercial companies, high-demanding and consequently costly types of customers may always be changing the schedule, returning goods, or requesting special services. Unlike other industries, it is not viable for healthcare facilities to deselect or “fire” a patient the way a commercial company can when the customer shows no promise of ever being profitable. Costs will be incurred regardless of the existence or type of insurance coverage. Here’s where population healthcare management can lead to significant long-term cost reduction. Real change must begin with a series of questions such as:
Why are so many non-emergent patients showing up in the ER?
Why are so many patients no-show or late to pre-scheduled surgeries?
Why are Tuesday surgeries consistently off schedule?
What is the health or socioeconomic issue our community suffers from most?
And the most important question…
What changes can be made to work toward the betterment of our community and all our stakeholders?
Higher profit patients typically are one or a combination of 1) payers reimbursing at a higher level or 2) non-critical patients requiring a predictable level of care. What can be done about those patients that have a lower level of insurance, or worse have no insurance or are the high-maintenance type requiring a higher level of care? After the level of profitability for all patients are measured, they can all be migrated toward higher profits using “profit margin management” techniques discussed further in this article. Making a very unprofitable patient less unprofitable by $1,000 is equivalent to making an already profitable patient more profitable by the same $1,000.
If a financial class type of patient is paying a lower rate for the same treatments and services as other providers in the area, then renegotiate the rate! But first, collect the necessary patient-level cost data to report and display the actual costs incurred for that type of patient. If an age group, gender, or zip code tends to be less profitable, then research the details. Why is that happening? Is it a cost issue, a collection issue, or both? Are there social factors such as English as a Second Language (ESL), lack of transportation to and from the facility, or illiteracy that are preventing or adversely affecting the delivery of quality care? Could the cost of additional social services be justified by better long-run profitability and patient outcomes? Solving problems begins with identifying high-cost cases, asking a lot of questions and finding common denominators. Discovery and interrogation is a cornerstone to the increasing popularity with analytics and Big Data. The road to valid solutions is paved in data.
Activity-Based Costing (ABC) is a Multilevel Cost Reassignment Network
Activity-based costing (ABC) is the accepted method that will economically and accurately trace the consumption of a health system’s resource expenses (e.g., salaries, supplies) to treatments, procedures, and patients and also to the types and kinds of channels and delivery segments that place varying degrees of workload demand on the facility. It should no longer be acceptable to not have a rational system of assigning so-called nontraceable expenses that are consumed as cost to their sources of origin – spending. ABC is that system. Yet many healthcare facilities still use do not use ABC. The excuses for this are many and include:
We are profitable, so why does it matter?
We already know our “true” costs from our general ledger financial reporting system.
We have done it this way forever. And we don’t do ABC here. We already know everything. It is in our heads.
We are a small hospital. We’ll worry about better costing methods when we get larger.
All this hype is just made up stuff from highly paid consultants.
No one looks at the reports we create, so there is no point generating better reports.
We cannot afford better software to fix our problems.
We are way too busy doing other things.
ABC uses multiple stages to trace and segment all the resource expenses as calculated costs through a network of cost assignments into the final cost objects: diagnoses, procedures, treatments, services, distribution channels, patients, etc. It facilitates more accurate reporting because it honors costing’s causality principle (i.e., the relationship between cause and effect) for expense consumption relationships. It answers not only WHAT your staff is doing, but also more importantly HOW MUCH and HOW COME. Consider the adage “In the land of the blind, the one-eyed man is king”.
ABC software is arterial in design, so it flows costs flexibly and proportionately to how and why the resource expenses are consumed. Eventually via this expense assignment and tracing network, ABC reassigns 100% of the resource expenses into the final accumulated costs of treatments, procedures, services, materials, channels, patients, and business sustaining work. Visibility of costs is provided everywhere throughout the cost assignment network, including for how costs are “driven” by the activity cost drivers that comply with the cause-and-effect relationships. This visibility aids in identifying where to focus improvement efforts.
Examine the ABC cost assignment network in Exhibit 1 that consists of three modules connected by cost assignment paths. ABC provides a snapshot view of a time period’s costs (e.g., a month). Imagine the cost assignment paths as wide pipes and thin straws where the diameter of each path reflects the amount of cost flowing. The power of an ABC model is that the cost assignment paths and their destinations trace costs from beginning to end— from resource expenses to each type of treatment and service (and optionally to each specific patient). Patients are the origin that results in the consumption of all of a facility’s originating expenses and subsequent costs.
Exhibit 1 – ABC Cost Assignment Network

To understand why patients are the origin for costs, mentally reverse all the path arrowheads in Exhibit 1 from bottom to top. This polar-opposite switch reveals that all expenses originate with a demand-pull from patients— and the calculated costs simply measure the consumption effect in the reverse direction. The same could be said for customers in any industry.
Resources, at the top of the cost assignment network in Exhibit 1, provide the available capacity to perform work. Think of resource expenses as coming from the facility’s checkbook in the form of procurement purchases and employee payroll. Cash is exiting the treasury. Examples of resources are clinical and non-clinical staff, medical supplies, and fixed assets. (Amortized cash outlays, such as for depreciation from a prior period, can also be modeled.) It is during this step that “resource cost drivers” are identified and measured as the mechanism to convert resource expenses into work activity costs. One basis for tracing or assigning resource expenses is the time (e.g., number of minutes) that people or equipment spend on performing work activities. All cost assignments in the cost assignment network must normalize to 100% whether one uses time, quantities of the driver, or percent estimates from knowledgeable employees.
Work is performed by both clinical and non-clinical staff (the most expensive assets in healthcare by far!), and resources are converted into the patient outcome and overall patient experience. Activity cost drivers are the mechanism to accomplish each assignment from the work activity cost to a final cost object. This can help to prove or disprove the alignment between the mission of the staff and what they are spending most of their time on. An example in a warehouse is the number of stocked items picked. In a bank, it’s the number of automobile loans processed. In a hospital, it may be the number and type of lab tests administered. A bonus from ABC is it calculates unit-level cost consumption rates, which are useful for comparative benchmarking studies as well as for projecting future expenses and costs such as with rolling financial forecasts, what-if scenario analysis, and outsourcing decisions.
Final cost objects, at the bottom of the cost assignment network, represent the broad variety of outputs (e.g., treatments and services) where costs eventually accumulate. Patients are the final-final cost objects. They create the need, or at least the perceived need, for resource expenses to be supplied. It’s important for financial and clinical leaders for a health system to have an open discussion on which patient-care costs are clinically necessary, and which are more of a “nice to have”, or perceived need. Are there clinical studies showing the newest, shiny implant will result in better outcomes? Healthcare providers are as susceptible to marketing trickery as any other type of buyer. Healthcare leaders must have this self-awareness and make decisions based primarily on data-driven unbiased research.
The key to a good ABC system is the design and architecture of its cost assignment network. The “nodes” in the network are the sources and destinations through which all the expenses are reassigned via calculated costs. The network with its nodes delivers the utility and value of the data for decision making.
Exhibit 2 displays the type of results from ABC. It reveals the myth that the highest volume patients in terms of services are proportionately profitable. They are not. For example, some high volume patients are located below the breakeven profit line. They are likely requiring unprofitable treatments and procedures.
Exhibit 2 – Patient Revenue Volume versus Profits

Migrating Service Line to Higher Profitability
The crucial challenge is not to use ABC just to calculate valid patient profitability information from transactional data but to really use the information—and use it wisely. And often. Knowing that some patient types will cost more than others (and there’s only so much one can do to reduce those costs before quality begins to suffer), it is paramount to know and capitalize on those treatments and services that are profitable and from which there is potential to increase market share.
The left-to-right sequence of the activity cost drivers creates profit margin layers like layers in an onion’s skin. As a result, there can now be a valid P&L statement for each patient as well as logical segments or groupings of patients. Exhibit 3 is an example of an individual patient profitability statement.
Exhibit 3 – ABC Patient Profit and Loss Statement

With an ABC P&L, managers can examine the individual services and materials purchased from suppliers in greater detail. They can also analyze the mix of high- and low-treatment-profit-margin treatments “consumed” by the patients, based on their own unit costs and prices, as a composite average. Managers can also drill into details about the treatment and service-mix profit margins for more visibility. In addition, within each type of treatment and service, the manager performing as a business analyst can further examine the content and cost of the work activities and materials for each treatment and service. This patient P&L information quantifies what many employees already may have suspected. All patients are not the same with their profit levels excluding volume as described in Exhibit 2.
In any health system’s P&L there are two major “layers” of profit margin:
By the mix of treatment, procedures, and services offered.
By the “costs to serve” patients apart from the unique mix of services, treatments, and procedures. (This is that “bottom half of the picture” referred to earlier.)
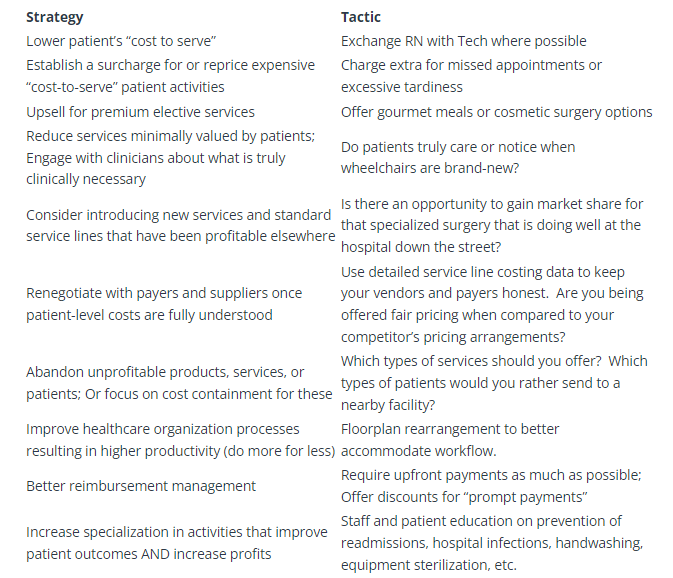
Exhibit 4 combines these two layers as a two-axis grid: (1) the “composite treatment and service profit margin” of what each patient “consumed” (reflecting net prices to the patient) and (2) their costs to serve. Individual patients (or a grouped cluster of patients with similar traits) are located at intersections where the circle diameters reflect each patient’s revenues to the hospital. Exhibit 2 debunks the myth that all volumes are good volumes. The objective is to generate more profits, or operate at a more efficient level for all patients regardless of their intersection location. This is represented by driving patients to the upper-left corner of the grid. Examples of actions that will do this are represented in the Strategy/Tactic table in the next section.
Exhibit 4 – Migrating Patients to Higher Profitability

When analytics software is applied, hospitals can use profit increasing techniques used in commercial companies where their finance and marketing staff determine “next-best-offer recommendations” based on a market basket analysis of their offerings to customers. The analysis uses “association rules,” which identifies items that frequently follow other items in transaction-based data. For example, if patients with a specific DRG typically have services A and B with supplies Y and Z, some physicians may order only service A for a sect of patients and a less expensive supply of X instead of Y. With that insight, financial leadership can talk to clinical leadership to understand the variability in care. The point isn’t to suggest to physicians the best clinical path, but to discuss when the extra cost is justified. Generating these needed conversations and creating higher levels of incentives and accountability is the reason for the emergence of value-based initiatives such as Accountable Care Organizations (ACO), Gainsharing, and bundled payment programs such as Bundled Payment for Care Improvement (BPCI) and Comprehensive Care for Joint Replacement (CJR).
Note that migrating patients to the grid’s upper-left corner is equivalent to moving individual data points upward in Exhibit 2. Knowing where patients are located on the matrix requires ABC information. An important reason for knowing where each patient is located on the profit matrix is to protect the most profitable patients from competitors.
Options to Raise the Profit Cliff Curve
What does a healthcare facility do with the patient profit information? In other words, what actions can it take to increase profits from its patients?
Although in Exhibit 5 below this is only a partial list of examples, a facility can increase profitability by doing the following:
Expand the Function
Much has been written about the increasing role of CFOs as strategic advisors and their shift from a bean counter to a bean grower. Now is the time for the CFO’s accounting and finance function to expand beyond financial accounting, reporting, and governance responsibilities. There should always be a balance between managing the level of patient care to earn patient loyalty and the spending impact that doing that will have on long-term sustainability for both the patient and the health system.
A longer-term goal for all health systems stakeholders (i.e., patients, community, employees, vendors, suppliers, and partners) is to provide quality care for a patient population, while “keeping the doors open”. Think of each patient as if they are an investment in a stock portfolio. Think that the purpose of actions taken is to increase the financial and non-financial “return on patient (ROP).”